Building an open source weather station
In 2018 I got involved in Ecosystem Restoration Camp Altiplano, a regenerative agriculture project in Southern Spain. Camp Altiplano is a collaborative project intended to restore biodiversity and soil fertility, to explore and share alternative farming methods and to teach people about soil degradation and about the regenerative techniques that can be used to reverse such degradation. The camp is located in the Altiplano region of Murcia, a high plain that is dry, cold and windy for much of the year and warm and windy in summer. This is a very difficult climate for agriculture, and farmers in the region struggle with short growing seasons, drought, high erosion rates and rapidly decreasing soil fertility. To obtain more insight into actual climate conditions, I decided to construct a simple weather station for the camp.
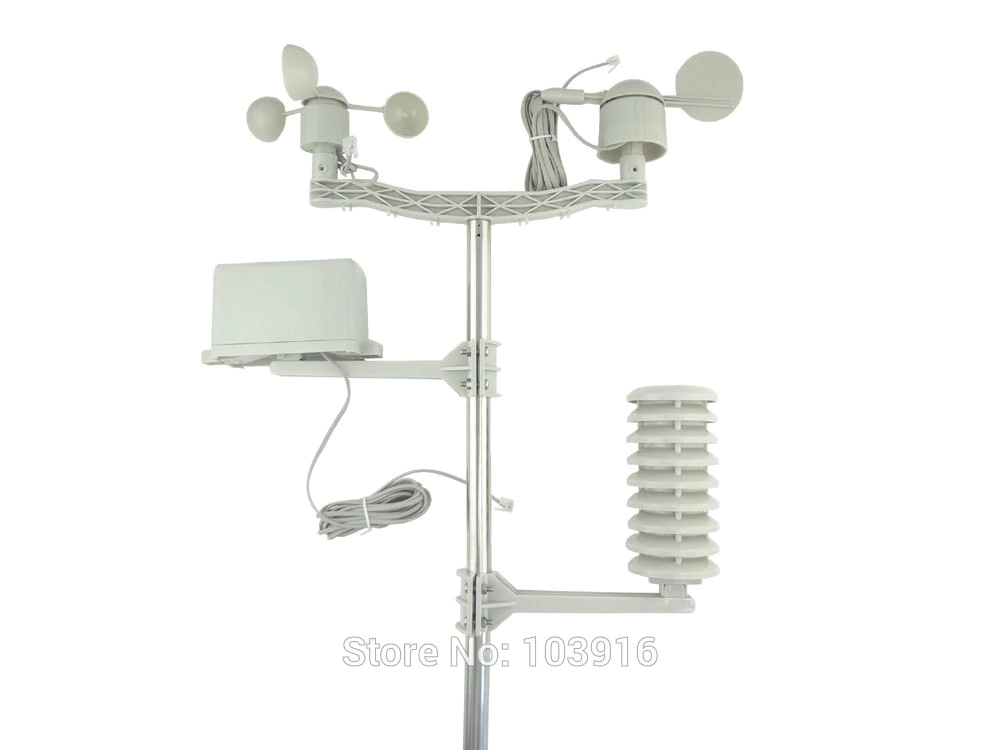
As it is nontrivial to build a calibrated wind speed meter (anemometer) yourself, I decided to order replacement parts for a commonly used low-cost weather station on AliExpress. The kit I ordered includes an anemometer, a tipping-bucket rain gauge, a wind direction vane and a unit for measuring temperature, humidity and pressure, protected by a radiation shield. As it turns out, nearly an identical set can also be ordered from Sparkfun as article SEN-08942, although it is more expensive and doesn’t include a radiation shield, which is important to have as we shall see (although you can also build one yourself).
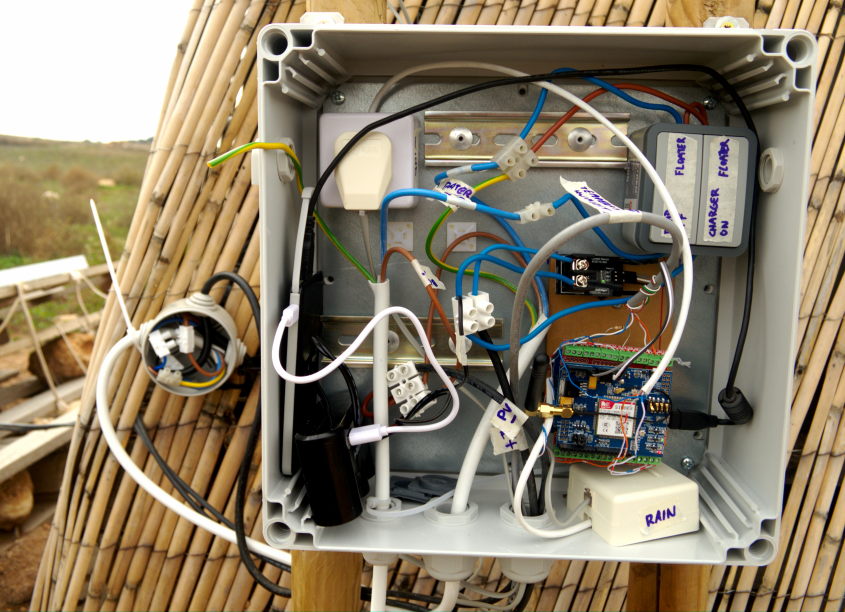
Instead of using some cheap black-box measuring unit, my weather station is based on an Arduino Uno, and a variety of external sensors to collect environmental measurements. As the station is located in a fairly remote off-grid area, it is powered by a solar panel and a battery pack, and measurement data is sent to a server using a 2G cellular modem with a cheap M2M SIM-card.
Additional sensors and parts I used include the following:
- To measure air temperature and relative humidity, I used a Sensirion SHT31-D temperature and humidity sensor, which has an accuracy of ±0.3°C and ±2% relative humidity, and is connected though I2C. Other sensors can also be used of course, as long as they have a reasonable accuracy. Cheap sensors such as the DHT11 tend to be very inaccurate, especially with regard to humidity, so try to avoid these.
- To measure air pressure I used an LPS25H air pressure sensor, which has an accuracy of ±0.2 mbar. Again, other good-quality sensors can also be used. This sensor is also connected to the I2C bus.
- To measure soil temperature I used a waterproof DS18B20 temperature sensor. Not the most accurate sensor, but cheap and good enough to give a reasonable indication, and several sensors can be used on one connection (a one-wire bus).
- For time keeping (and possibly data storage in future), I used a data logger shield, which includes an SD-card slot and a battery-powered real-time clock (RTC). The shield I have uses a DS1307 RTC, but other shields may provide other RTC chips (which may actually be better).
- For communication I used a modem shield with a SimCom SIM808 cellular modem. There are various shields available, with various SimCom modem types (SIM80x, SIM90x) that all use basically the same AT-command set. These modems are inexpensive (under $10), although they are limited to 2G (GPRS) and the shields for Arduino may be quite costly. You can also look for a cheap SimCom modem module and connect it to the relevant Arduino pins, but note that the modem is 3.3V so you may need to use a level shifter if you use a 5V Arduino board. Other modem brands can also be used, but will probably require different AT-commands.
- A SIM-card will be needed in order to send the data over a cellular data link. I used an international roaming IoT SIM from Tele2, but there are many, many companies that can provide you with cheap M2M data SIM cards, either prepaid or with a subscription plan.
- For power I used a cheap car USB-adapter (the kind that is normally used with 12-24V cigarette lighter sockets in cars, trucks, caravans, boats, etc.) to convert the ~18 Vdc solar panel voltage to 5 V, and a cheap off-the-shelf USB powerbank (10400 mAh, eventually) to provide power when the sun is down.
- To house the electronics I re-used a waterproof case with an IP65 rating (from a work project), and I also re-used various wires and other bits to connect everything up, including “waste material” such as electricity wire cuttings and some old telephone connection boxes.
- I used a simple Arduino screw shield to easily connect the sensor wires (which were mostly soldered to left-over bits of UTP cable).
- To get some idea of power consumption and PV-production, I also connected an ACS712 30A current sensor in series with the solar panel, and connected its output to one of the Arduino’s analog inputs.
I also tried adding a simple FC-28 soil moisture sensor, but the sensor PCB heated up significantly, so I disconnected it again to avoid draining the battery pack and disturbing the temperature measurements… I still need to look into better alternatives.
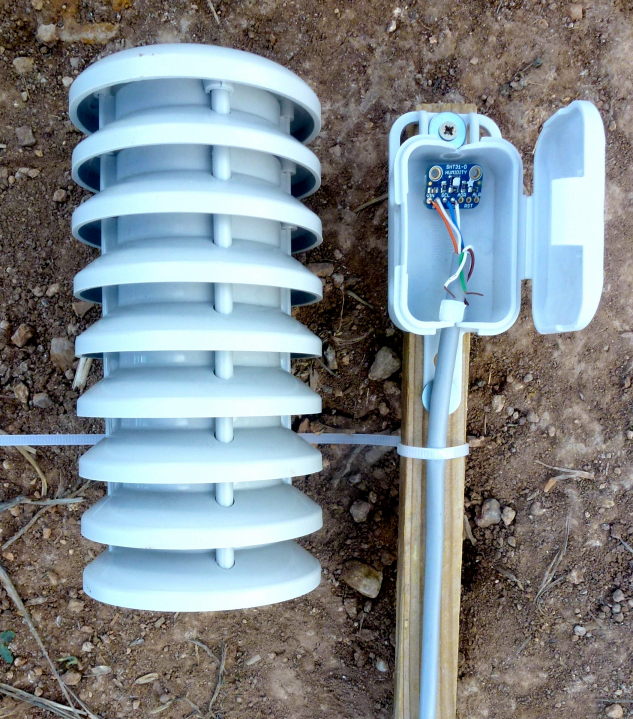
For accurate air temperature measurements, it is important that the temperature sensor is mounted in a way that prevents heating up by direct sunlight, as least as much as possible. Usually this is done using a radiation shield, which should be reflective (e.g. painted white or silver) and allow for good ventilation, while protecting the sensor from weather damage (e.g. from rain). The idea is that ambient air can move more or less freely past the sensor, as any housing will still heat up somewhat when exposed to sun. Various designs can be found on the internet, e.g. the one described by Holden et al. (2013) or Terando et al., or the “Homemade Gill” described by Tarara & Hoheisel (2007). The Citizen Weather Observer Program also lists some radiation shield designs, and many other DIY manuals and 3D printing designs can be found online. I decided to keep it simple and use the plastic radiation shield that came with my Chinese weather sensor kit. I found a small plastic enclosure that fit perfectly inside the radiation shield, and used that to mount and protect the temperature and humidity sensor (as the air humidity at Camp in autumn and winter can be quite high). It’s not entirely ideal with regard to movement of air, but at least there is no direct contact between the sensor and the outside housing, and this construction seems to work reasonably well given the generally windy conditions at the measurement site. The main drawback seems that earwigs like to use the radiation shield housing as a hiding place on warm days in spring and summer…
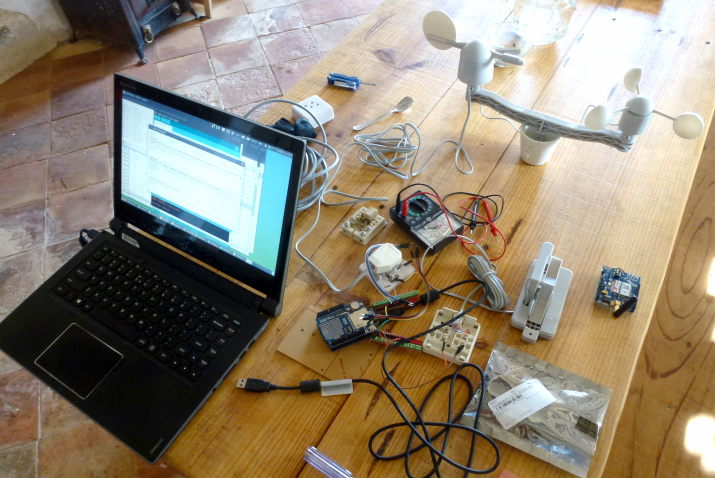
Initial testing of the sensor hardware and writing the weather station software was literally done on the kitchen table, in a farm house in the former village of La Junquera, near the Camp.
The documentation for the weather station parts is a little sparse, but luckily some example code was available on the Arduino forum. The mechanical sensors for wind and rain use small magnets that close a magnet reed switch, which can be detected as a short voltage pulse on one of the Arduino’s digital input pins. However, an important detail that isn’t mentioned in the documentation is the fact that the magnet switch contacts used in the anemometer and the rain gauge are mechanical, and therefore tend to “bounce” a few times after making definitive contact. Especially if you’re using an interrupt handler to detect the sensor pulses, these “contact bounces” may end up generating multiple pulses per magnet pass. You therefore need to include a little “debounce” delay before accepting the next sensor contact pulse. After some testing, a debounce time of 15 ms proved to be sufficient for the anemometer and the rain gauge.
Reading the digital sensors proved to be fairly straightforward, using various Arduino libraries which you can simply install through the Library Manager in the Arduino IDE. I used the following libraries:
- Adafruit_SHT31, to read the SHT31 temperature and humidity sensor
- LPS, to read the LPS25H pressure sensor
- DS18B20, to read the DS18B20 soil temperature sensor
- Wire, for I2C-communication (required for the SHT31 and LPS25H)
- OneWire, for 1-wire communication (required for the DS18B20)
- RTClib, to communicate with the Real Time Clock
- NeoSWSerial, to communicate with the modem over a software serial connection. In principle, it would be better to use the hardware serial UART, but unfortunately the Arduino Uno only has one UART, which is also used for the USB serial monitor. So if you want to be able to debug your code on an Uno while using the modem, you need to use software serial for the modem.
- Optionally, you can use Fat16 or SD, to write CSV-data to an SD-card. Currently this does not work on the Arduino Uno unfortunatey, as its microcontroller has insufficient on-board memory.
With the temperature sensors, care should be taken not to read them too frequently, as the sensors will heat up slightly on each reading and this becomes noticable in the measurements at higher frequencies. Currently, I use a delay of 12 seconds between digital sensor readouts.
In essence, the Arduino sketch continuously counts pulses coming from the wind speed and rainfall meters. Every 12 seconds, it reads out the various digital sensors, and measures the current drawn from the solar panel. Every 36 seconds or so, it tries to determine wind speed and wind direction. For most variables, the mean, minimum and maximum values are tracked for a period of roughly 10 minutes, after which these values are reported to a remote server. The reporting is currently rather basic: the Arduino asks the modem to open a TCP-socket, and then simply sends a line of comma-separated values to the server. The server is basically a Python-script that sits listening on a port, reads the line of values and dumps it to a CSV-file after checking it and adding a timestamp. It also forwards some of the weather data to two open weather observation networks, but more about that later.
The source code for the weather station, both for the Arduino and the server, can be found here on Github: https://github.com/lvzon/weatherstation
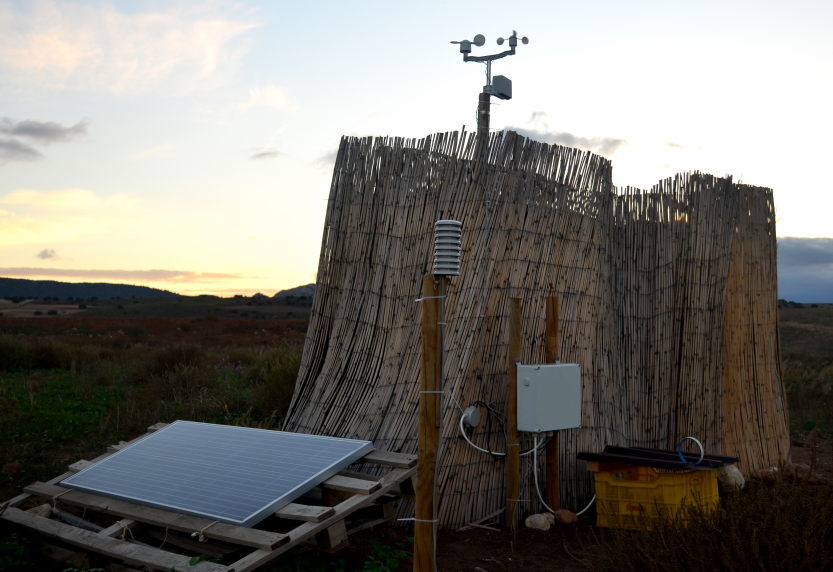
After writing and testing the software, the equipment needed to be installed in the field. Because the station requires a power source, I decided to install it at the site of the two 1000L water tanks that are used as water storage for the drip irrigation system. The water tanks are placed on a relatively high part of the land, so that irrigation water pressure is provided by gravity at night. During the day, water is pumped up to the tanks from one of the ponds, using a submersible DC pump (12 Vdc, max. 10 A, 120 W) that is directly connected to a solar panel (max. 150 Wp, 18 Vdc, 8.25 A) with a floater switch. When there is sufficient sun, the pump runs and the tanks are refilled, at which point the floater switch turns off the pump. On a normal day, the solar panel can provide much more energy than is required for the pump, so it can easily provide power to run the weather station as well.
I mounted the wind sensors and the rain gauge above one of the water tanks, as they need to be clear of obstacles as much as possible in order to avoid wind turbulence and drag. Ideally they would be 10 m above ground level, but I did not have the materials to reach that kind of height, so they are now at around 3 m. The temperature sensor was placed 1.25 m above the surface, a few metres from the water tanks, above the cover crop. Further away would have been better, to avoid any temperature effects from the water tanks or the solar panel, but unfortunately the distance was somewhat limited by the length of the UTP cable that I had brought with me. The IP65-case with the electronics was placed in the shade of the water tanks, close to the solar panel. The soil temperature probe was buried 10 cm below the soil, not far from the air temperature sensor. The air pressure sensor (not shown in the pictures because it was added later) was placed in one of the ventilation openings on the side of the IP65-case. Apart from the electronics, two switches were also installed in the IP65-case. One can be used to switch off the water pump, the other to switch on an optional battery charger, which could be housed in a cobbed box next to the weather station.
While there have been a few minor issues with the software and with the battery pack I used initially, the weather station has been functioning fairly well since November 2018. Under normal conditions, weather data is uploaded every 10-15 minutes to two public weather station networks: the Citizen Weather Observer Program (CWOP) and the Weather Underground network.
More or less live weather information is available from the station’s CWOP dashboard, and short-term historical plots of CWOP-data can be found here and here. A more detailed automatic analysis is generated here. Weather data can also be viewed on the station’s Weather Underground dashboard, and the most recent temperature and wind speed are shown on this little widget:
Let’s examine some of the measurements that have been collected so far. You can download a ZIP-file with data from the weather station (as CSV) here. First, let’s look at air temperature:
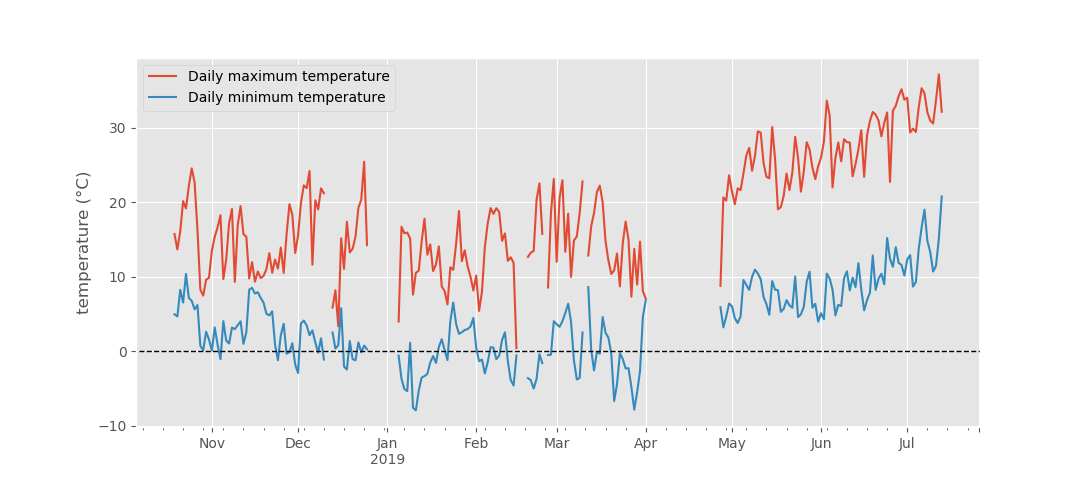
As can be seen, temperatures below freezing have occurred from November to at least March. The frost isn’t extreme, but it’s enough to ruin a crop. This year, it was uncommonly warm in late January and early February and March, which caused the almond trees to bloom early. Unfortunately, the frost at the end of March was sufficiently strong to destroy the flowers, leaving the farmers without an almond crop this year…
Another thing that can be seen is that on most days there is quite a large difference between the minimum and maximum temperatures. On average, the daily temperature differential is around 15°C (27°F), although on some days it can be well over 20°C (36°F). Such large daily fluctuations in temperature are quite common for dry, exposed areas such as the Altiplano region, where it can be quite cold at night even in summer, and quite warm during the day, even in winter.
You may also have noticed by now that there are gaps in the data. These were caused by a combination of two or three problems. First of all, the initial incarnation of the station used a 5200 mAh power bank, which worked fine on some days, but turned out to be insufficient when nights got longer and colder (as battery capacity decreases at lower temperatures). This caused the Arduino to lose power, usually in the early morning, but sometimes also at other times, especially in misty weather conditions. High humidity forms an additional problem for the station, as water vapour tends to absorb the signal of the mobile telephone network used by the station’s GPRS-modem, causing the signal level to drop and the modem connection to fail quite regularly in wet weather. Finally, it turned out that if the connection was dropped while the network socket was open, this would block the server so that no further data would come in until the server was manually restarted. This sometimes led to long periods without data before I noticed the problem, for instance in April. I made some modifications to the server code to reduce the issue (by adding a data time-out), although further improvements can still be made. And to reduce the problem of power loss, I replaced the 5200 mAh power bank by a bigger 10400 mAh model (which stores around 37 Wh) when I visited Camp the beginning of June, which did improve the situation. Unfortunately this new power bank (produced by Hama) briefly switches off the USB output power when the solar power comes online in the morning, and when the PV voltage drops in the evening, causing the Arduino to restart twice a day, which isn’t ideal, although it is better than the former situation…
The water content of the air is measured as relative humidity (RH), expressed in percent:
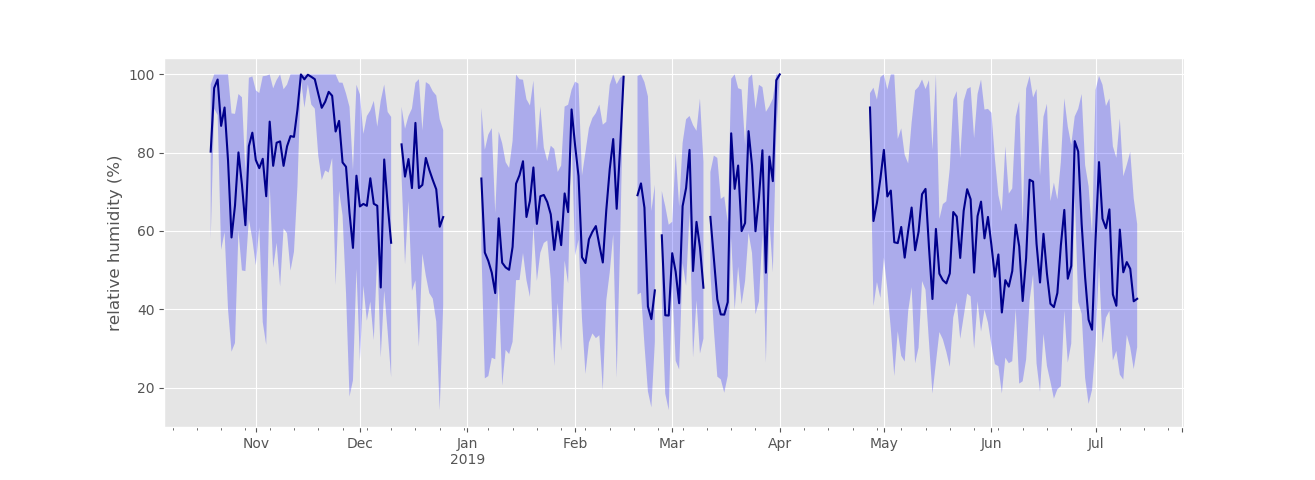
While our sensor reports values up to 100% in misty conditions, such high figures aren’t actually possible and should be taken with a grain of salt - the sensor is only accurate up to 95% or so…
As is visible in the graph, the air tends to contains more moisture in autumn and winter than in spring and summer, when it can be quite dry. Peaks in relative humidity generally occur after it has rained:
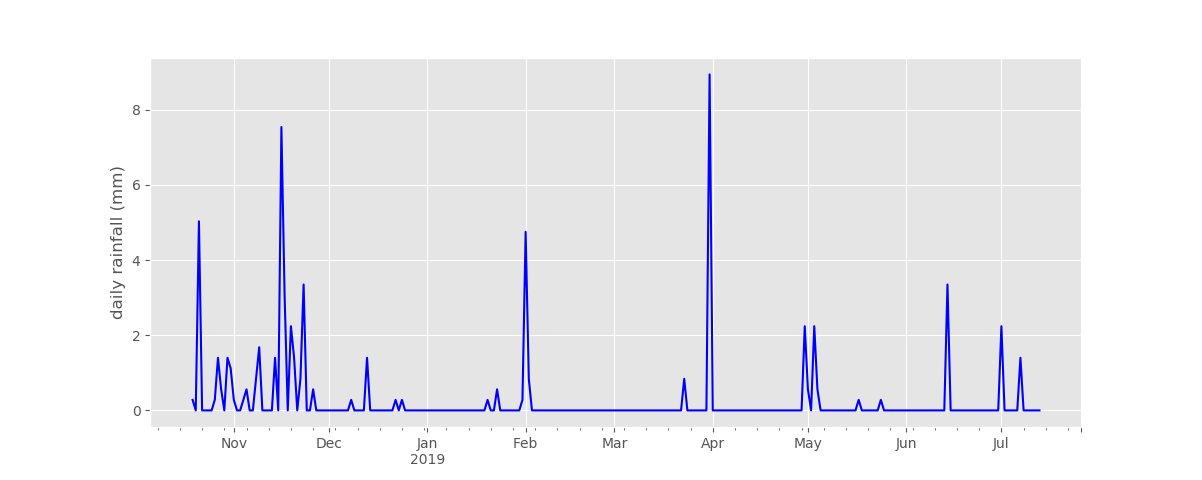
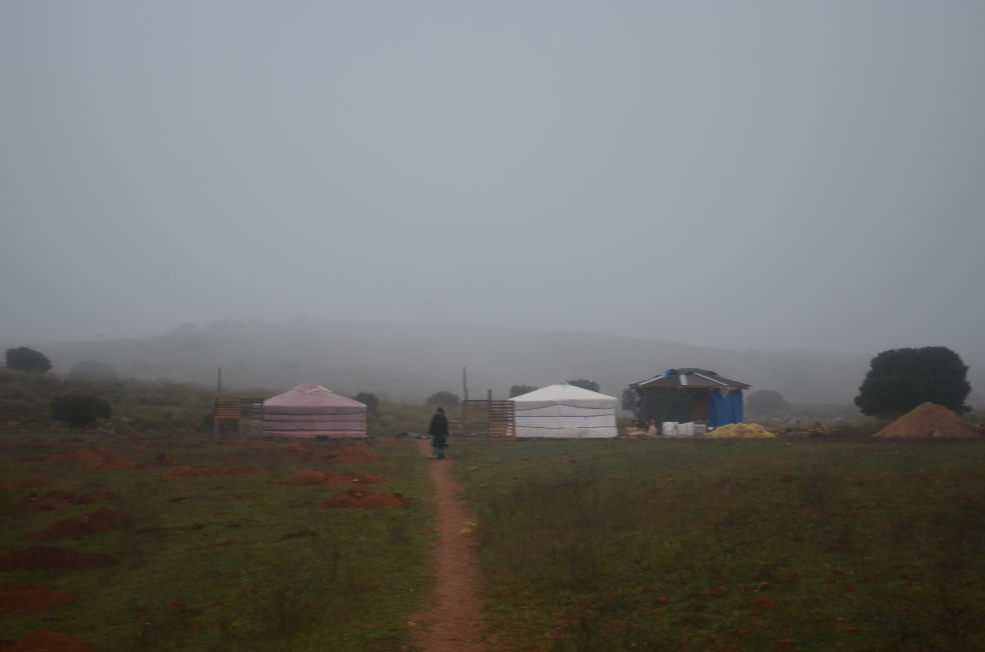
When relative humidity is high and there is no sun, conditions at camp can become pretty misty, wet and muddy. This is probably a good thing, as it is quite possible that condensation of moisture on the cover crop actually contributes significantly to the input of water into the soil, although we haven’t yet tried to measure this.
Rain and mist remain relatively rare occurrences at Camp though, for much of the year. One thing however that seems almost always present at Camp Altiplano is wind, sometimes lots of it. Here you can see the wind speed measured by the anemometer, in km/h:

As you can see, wind speed can be quite variable, with the majority of days seeing wind gusts at or above 20 km/h (12 mph) for at least some portion of the day, but also periods when there is almost no wind. You can also see that some days are extremely windy, with gusts over 60 km/h (37 mph). On one such day, one of the bell tents was actually lifted off the ground by the strong winds! Note however that, while stormy days occur more often in autumn and winter, maximum daily wind speeds tend to be higher in spring and summer. This probably has to do with the stronger temperature differences in summer, as we shall see below.
The above graphs mostly show mean daily values, together with the daily range. However, to better understand these observations, it is useful to look at what actually happens during the days and nights. The following graph shows the air temperature (at 1.2 m above ground) and the soil temperature (at 10 cm below ground), from early June to early July (with some loss of data on two days, around June 25th):
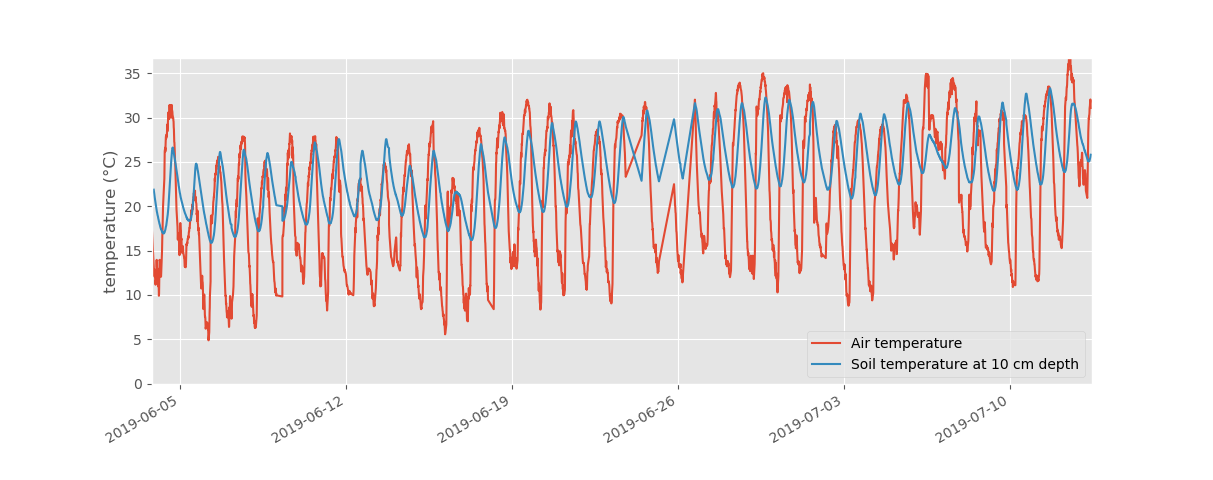
Here you can see more clearly that despite the fact that the days are long and afternoon temperatures are generally between 25-35°C (77-95°F), warm nights are actually very rare this time of year - the air tends to cool down quite a lot at night, sometimes down to a rather chilly 5°C (41°F). The soil however stays relatively warm at night. During the day the soil surface heats up in the sun, whereby exposed surfaces can easily reach temperatures over 40°C (104°F), as can be seen in this thermal image of the weather station area on July 3rd around midday (with a tilled almond field in the background, beyond the Camp border):
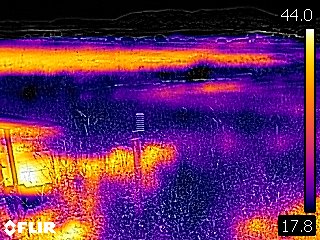
Part of this heat is re-radiated by the soil surface, warming up the air above it, and part of it is transferred to the soil below, which cools down only slowly at night. To get a better picture of what’s going on, we can zoom in on a few days in mid-June, and add some of the other weather variables:
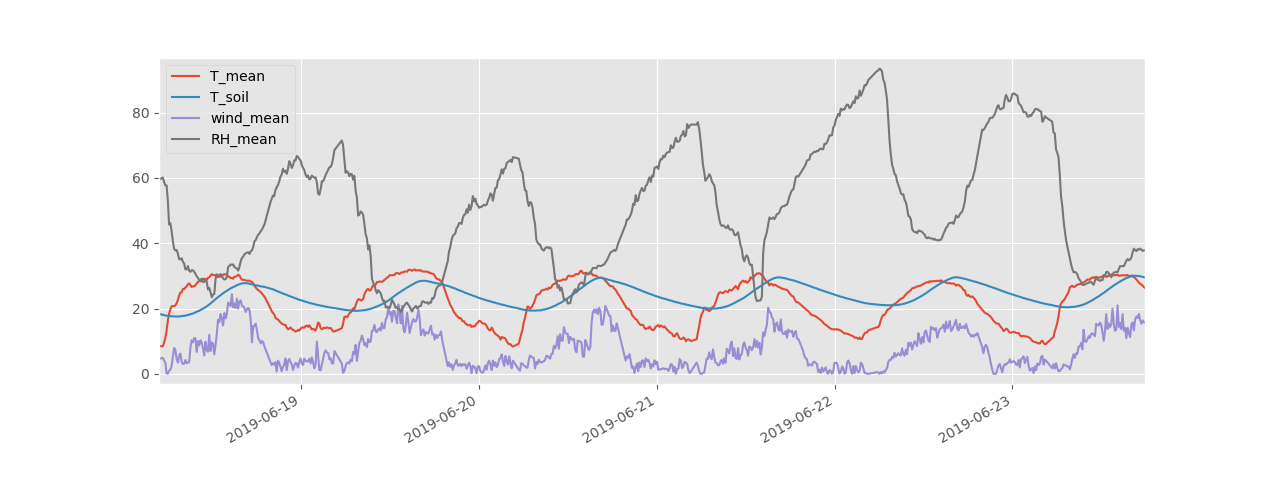
As the sun comes up and starts heating the surfaces, air temperature (red line) goes up and humidity (black line) goes down. The wind (purple) also starts to pick up, probably because the heat from the sun creates or amplifies pressure differences in the region. The soil temperature (blue line) lags a little behind the air temperature, because it takes some time for the heat to be transferred from the surface to the soil below (and also in the other direction at night). On warm days the soil temperature peaks a little below the air temperature, while it can exceed the air temperature on somewhat cooler days. There was no rain during this period, and you can see that the relative humidity can drop to roughly 20%. As soon as the sunlight decreases in strength, the humidity starts going up, the air temperature starts going down and the wind speed often reaches a peak and then goes down as well. When the sun is down, the wind speed drops and the soil temperature starts going down as the soil starts to cool by radiating heat. The humidity goes up further after sunset, and the air temperature will keep going down until sunrise.
When there is some rain (tiny blips in the yellow line), this mostly has an effect on the humidity, as we can see in the first week of July:
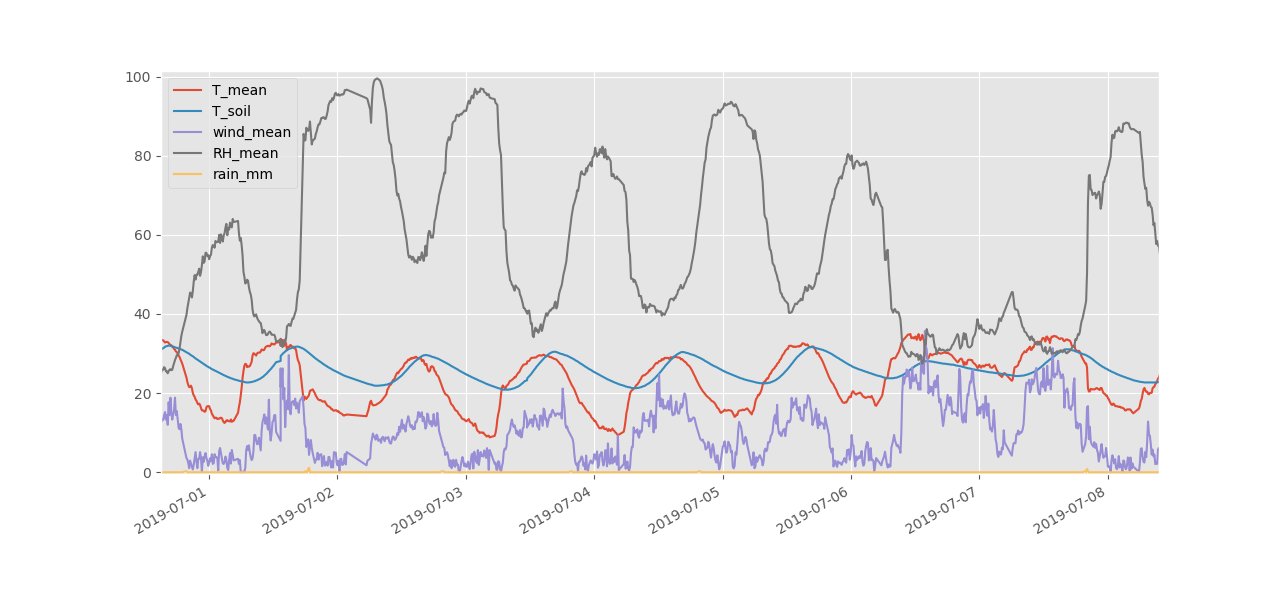
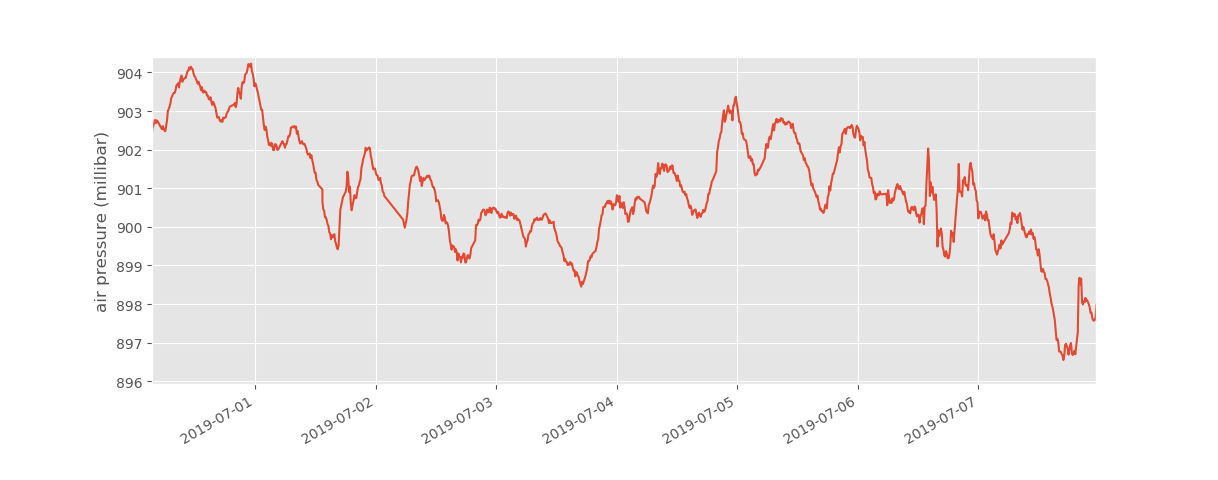
Even though the actual amount of rain was quite limited here (2-3 mm per event), it came down in a fairly short period, and it noticeably increased humidity and decreased temperatures, although the latter could also be caused by colder air moving in from elsewhere. If you look closely, you can see wind speed increasing and then dropping sharply just before the rainfall events, which usually is related to a low pressure system moving into the area. Such larger-scale weather systems often influence rainfall and air temperature in a larger area. In this case, you can see the air pressure dropping as the front passes over, with strong rainfall accompanying a drop in temperature and pressure, which would be consistent with a cold front moving in:
Apart from measuring weather variables, the station also measures the amount of current supplied by the solar panel, which can for instance be useful to monitor the operation of the water pump.
One important question is of course, how reliable are the weather measurements reported by the station? As reference, I looked at data from the agricultural meteorological station at Puebla de Don Fadrique, which is located a little over 20 km south-west of Camp Altiplano in a fairly exposed field next to a farm. Here is a comparison of daily temperature data from both stations:
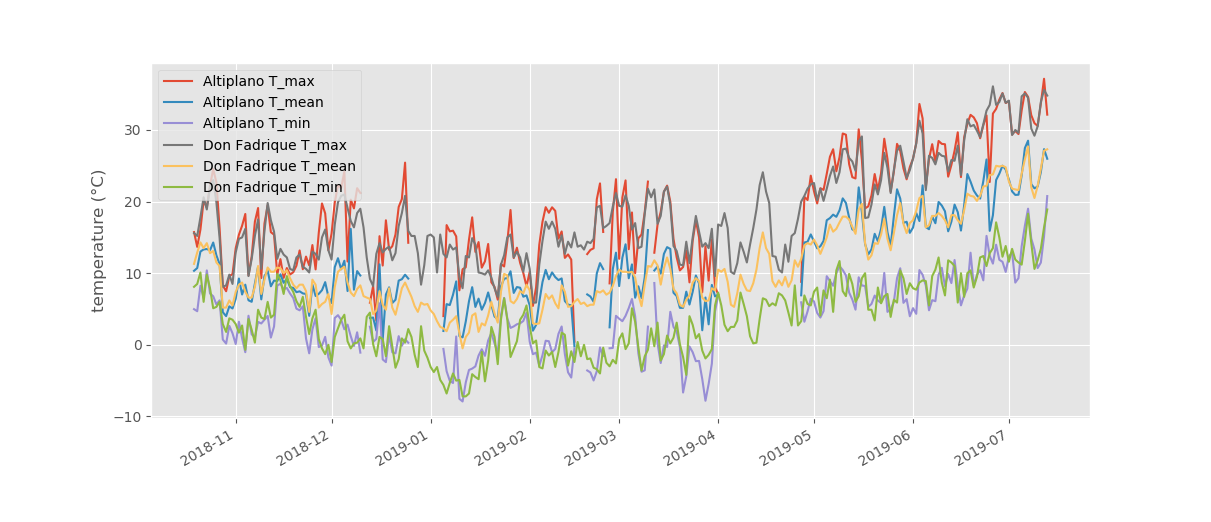
There are a lot of lines here, but if you look closely you can see that the temperatures measured at both sites are quite similar, except that extremes at the Altiplano station tend to be a little more pronounced and the mean temperature tends to be a little higher. This could of course be an actual difference between the two sites, although it is also possible that there is some small heating effect from the nearby solar panel at Camp, or that the radiation shield isn’t perfect.
The measurements of temperature and humidity seem good enough for our purposes. Rainfall however is a different story:
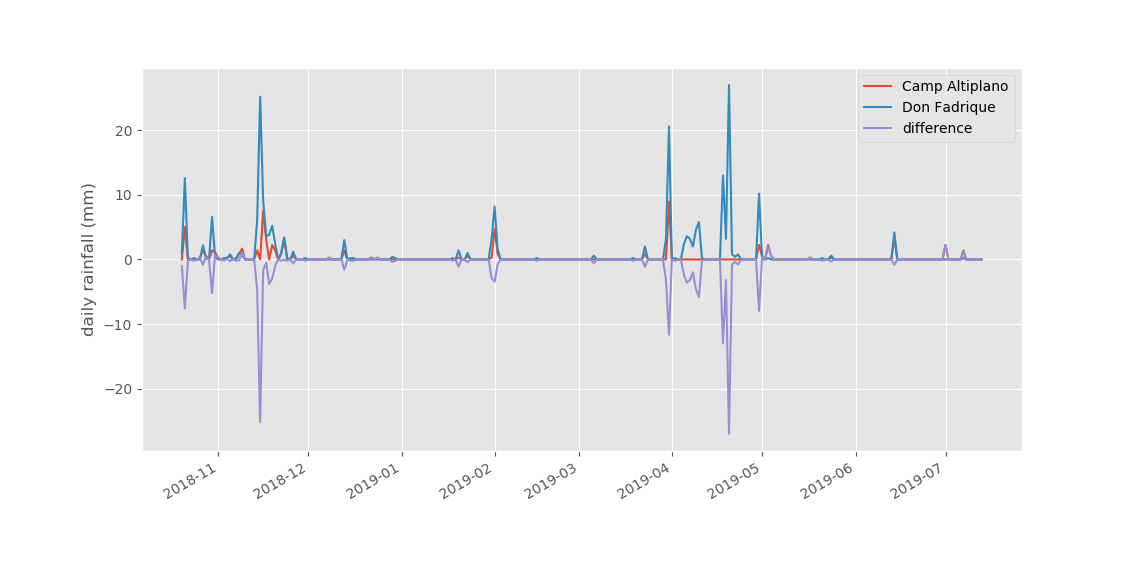
Unfortunately it is clear that the station at Camp Altiplano has grossly underestimated rainfall, especially before June. The precipitation reported at Puebla de Don Fadrique between October 19th 2018 and July 13th 2019 was 217 mm, while our station at Camp Altiplano only registered 66 mm over this same period. This was caused in part by the fact that the station often lost its internet connection as well as eventually its power source during wet weather, so that much of the precipitation wasn’t registered (as can be seen in October and November). Also, any rain that fell during longer periods without communication (e.g. April) wasn’t measured. The new power bank and the server modifications seem to have solved at least part of the problem. It is possible that there is still a slight underestimate of actual rainfall, due to the design and placement of the rain gauge (which may not work so well at higher wind speeds) and the fact that communication with the modem using the software serial library may temporarily disable interrupts, possibly causing rain gauge pulses to be missed occasionally. In a future version of the station I will use the hardware UART, which should get rid of the latter problem at least.
With regard to wind speed, it is very hard to tell if the measurements are correct without an additional reference instrument. The comparison with Puebla de Don Fadrique shows that the average wind speeds measured at Camp Altiplano are much higher:
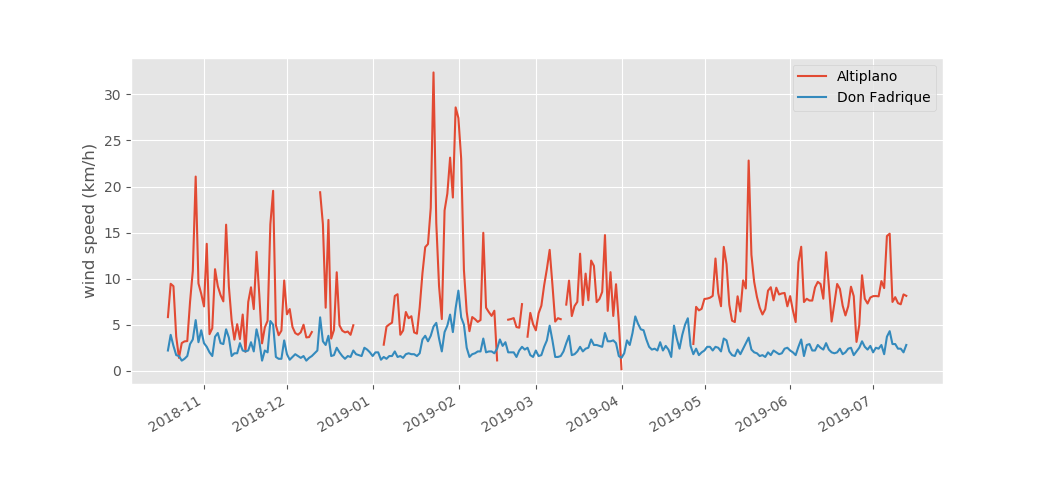
However, the (tiny) picture of the station at Puebla de Don Fadrique seems to show that anemometer there is placed quite close to the ground, and the measured wind speed may also be significantly reduced by the fence around the station (which would introduce significant turbulence):

Moreover, the measurement interval and averaging method are unclear and may also influence the mean wind speed that is reported. In my estimation, the wind speeds reported by the Puebla de Don Fadrique station would be way too low for the Altiplano site, and the mean wind speeds reported at Camp seem to be more or less in the range that I would expect. But it would be good to verify this at some point.
Conclusions
If you just want a reliable measurement of standard weather variables, you’re probably better off buying an off-the-shelf personal weather station, rather than building one yourself. It requires much less effort, it may sometimes be cheaper and if you pay some attention to specifications and reviews you will know more or less what you will get with regard to reliability and accuracy. With a DIY weather station, the quality of some measurements (such as wind speed) is much harder to establish, and you need to maintain a server infrastructure. Having said that, there are several advantages to building your own setup. First of all, most personal weather stations require an internet connection, which is problematic in remote, off-grid areas. The setup described here uses a cellular modem, which is something that most off-the-shelf consumer products don’t offer, unless you add it separately in the form of a cellular router (which can be quite expensive). Moreover, if you build your own system, you do have full control over design elements such as sensor quality, sampling resolution and data storage. With third-party equipment you generally depend on a proprietary closed system, from which it may also be hard to retrieve all your measurements. But perhaps most importantly for this project, the Arduino-based setup described here is very flexible and easy to extend, it allows you to add nearly any kind of sensor you can think of. I recently added a soil temperature sensor, and it would be easy to add more of these, e.g. at various depths or locations. Moreover, it is also possible to monitor other variables, such as soil moisture or the level, pH and conductivity of groundwater or surface water.
Future extension plans for the weather station at Camp Altiplano include an upgrade of the Arduino (e.g. to a Mega or Due, or better still, one of the newer Arduino MKR models with built-in modem and RTC), local data logging to an SD-card and the addition of additional sensors for soil temperature and moisture, and perhaps other variables of interest. I may even look into the establishment of a mesh network (using APC220, RF24 or ESP modules), in order to facilitate measurements at nearby sites. Hopefully the open source design described here will be useful for other Ecosystem Restoration Camps, and similar projects where it is valuable to collect high-resolution data on various environmental variables, beyond the “standard” weather station measurements of temperature, humidity, pressure and wind.
